1. Functionality Score ()
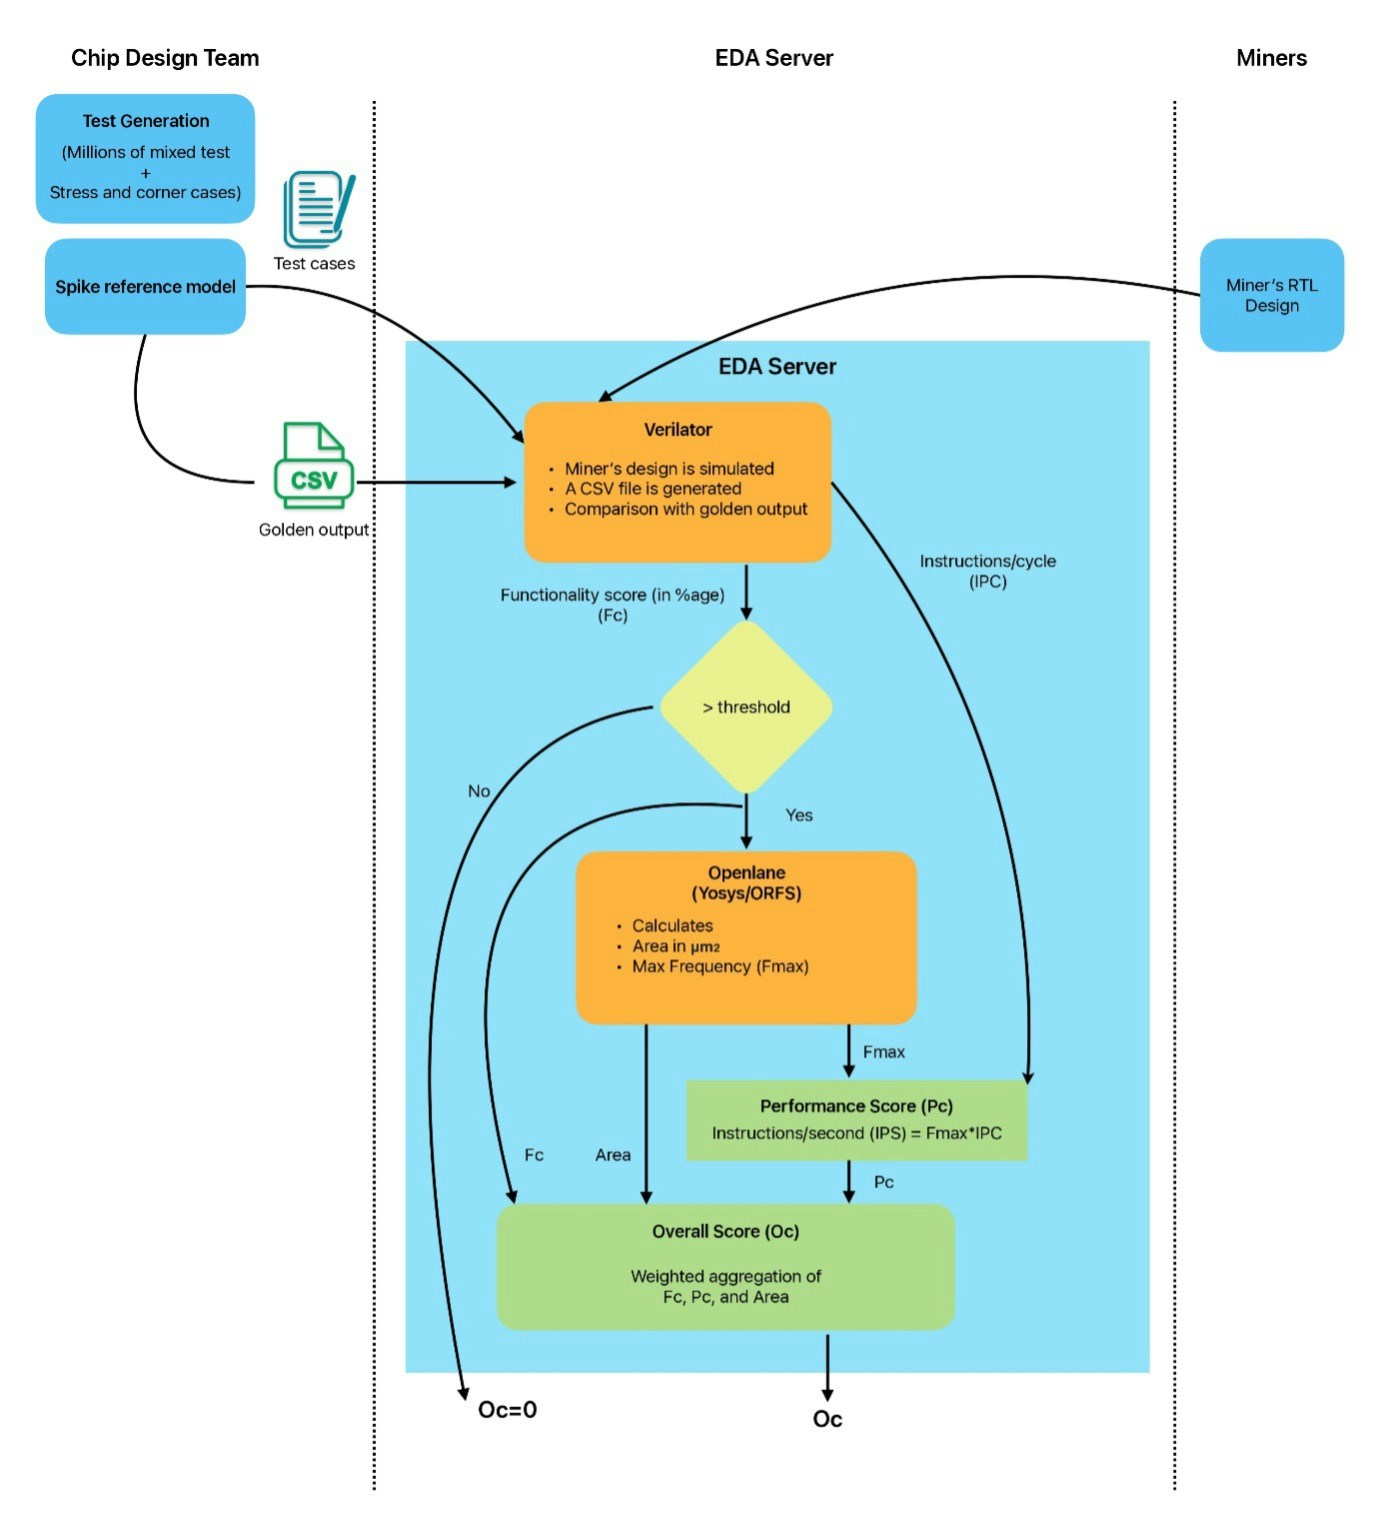
This metric measures the design’s functional correctness.- Test Generation & Golden Reference: The Chip Design Team creates comprehensive test suites and runs them on the official RISC-V ISA Simulator (SPIKE) to generate the “golden output.”
- Design-Under-Test (DUT) Execution: The same test cases are executed on the miner’s design using the EDA Server’s Verilator tool for simulation.
- Scoring: The score is determined by comparing the DUT’s results against SPIKE’s golden outputs.
is a value between 0 and 1.
2. Performance Score ()
Performance is quantified as Instructions Per Second (IPS), representing the processing throughput.- IPC & Max Clock Speed (): The processor’s Instructions Per Cycle (IPC) is measured using performance tests. The processor’s maximum clock speed, referred to as (Max Frequency), is determined through timing analysis using OpenLane.
- Performance (IPS): The throughput is calculated as:
- Normalization: This raw IPS value is then normalized against a defined benchmark IPS to yield the 0–1 score (a higher IPS results in a score closer to 1).